Feature
BI dashboards: uptime, utilisation and cost per vehicle
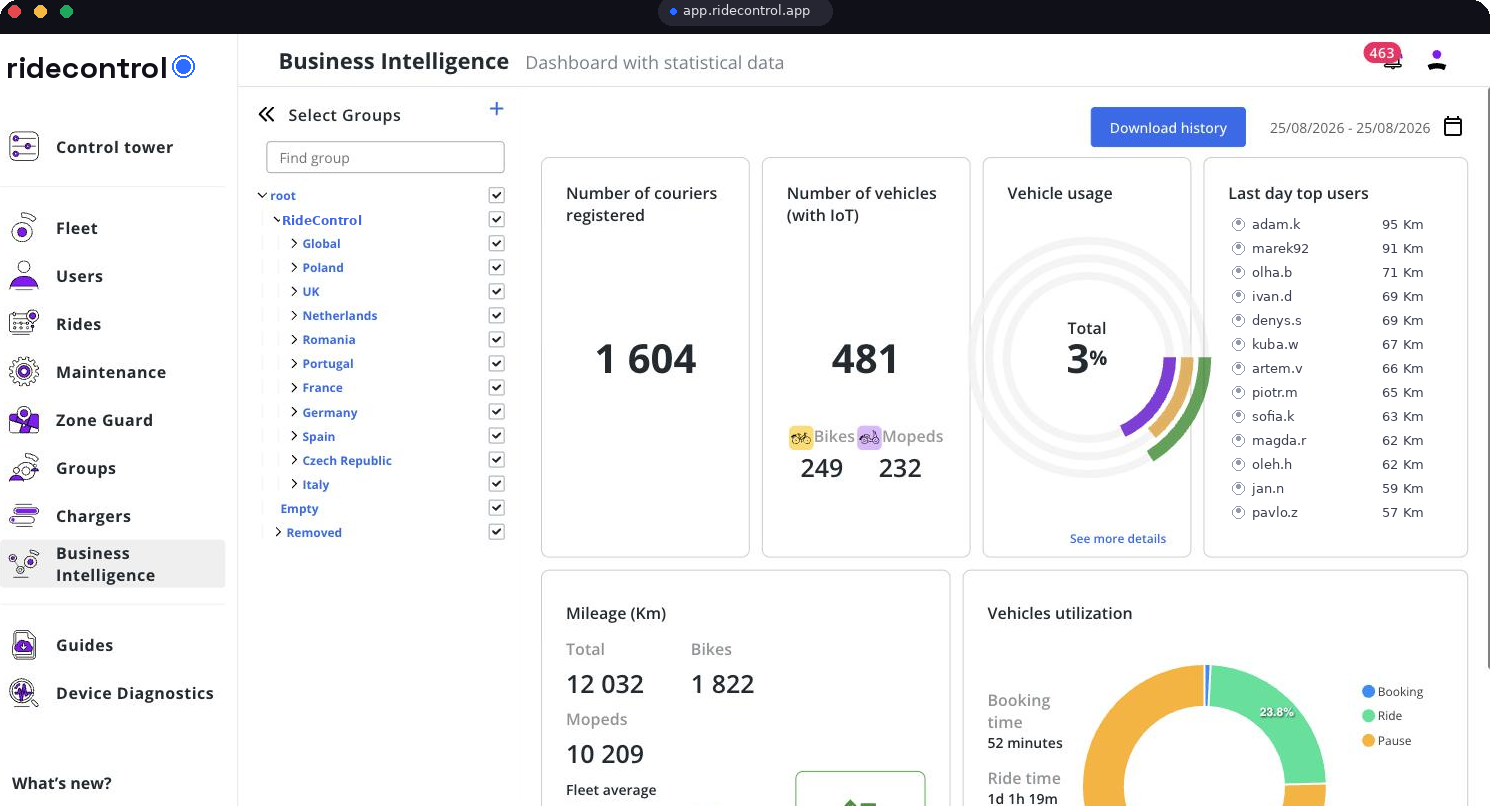
The questions that decide a delivery fleet's margin are simple: how many vehicles were available, how hard did they work, and what did each one cost. RideControl answers them per group, hub and country.
Fleet view
Uptime · utilisation · cost
What the dashboards show
- Uptime and availability per vehicle, hub and country.
- Utilisation: vehicles on route against active vehicles over time.
- Delivery trip volume, distance and duration.
- Cost per vehicle, combining repairs, downtime and usage.
- Week-on-week and hub-to-hub comparison on the same definitions.
How it works
Step 1
Modules produce facts
Trips, service requests, assets and events are recorded as you operate — no separate data entry.
Step 2
The group tree aggregates
Numbers roll up from vehicle to hub to country automatically.
Step 3
Views are filtered
Pick a period, a hub or a client account and the whole dashboard follows.
Step 4
Finance exports
Any view goes to CSV with the underlying rows, not just the chart.
Step 5
Systems consume
The REST API and webhooks push the same numbers into your BI stack or a delivery platform's reporting.
Who uses it
| Role | What they use it for |
|---|---|
| Founder / CEO | Fleet economics per country at a glance |
| Operations manager | Availability targets and hub comparison |
| Finance | Cost per vehicle and monthly reporting |
| Client account manager | Reporting uptime to the platform or client you serve |
Data you get out
- CSV export of every view, including underlying rows.
- Read-only API access from the Growth plan, full read/write on Scale.
- Webhooks for events such as zone exit, service due and battery alarm.
- No lock-in and no export fee — the data is yours.
Related modules
Ride analytics supplies trips, Service Flow supplies repairs and downtime, asset inventory supplies the asset base, and groups decide how it all aggregates.
Frequently asked questions
Related
See it on your own fleet
Book a 30-minute walkthrough. We open the panel with your vehicle types, hubs and countries in mind — no slides.
Book a demo