Feature
Control Tower: one live screen for the whole delivery operation
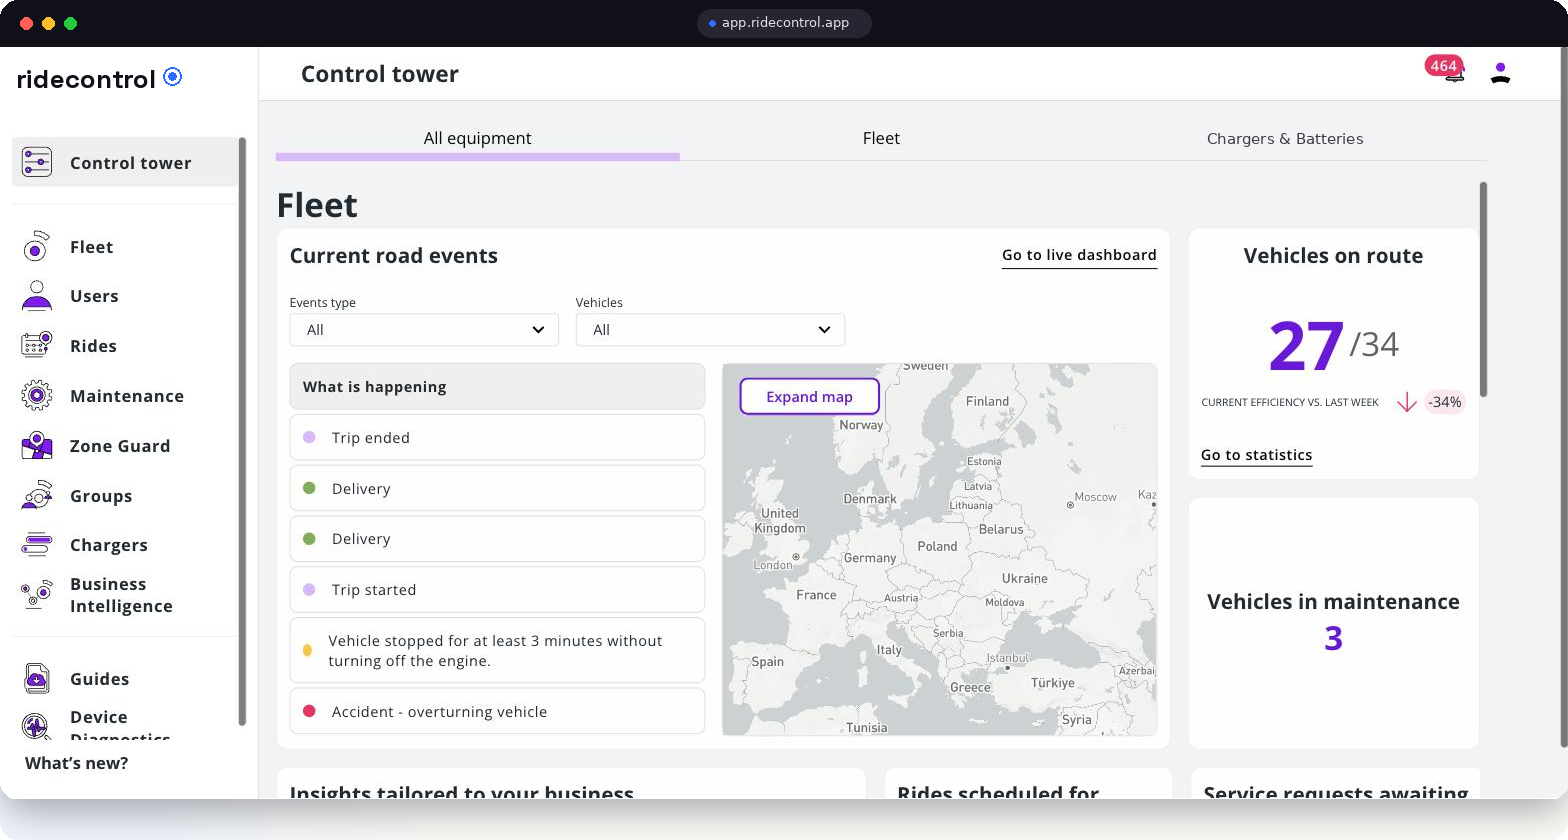
Dispatch stops refreshing three tools. Control Tower shows live road events, how many vehicles are on route versus the size of the fleet, and how this week compares with the last one — with alerts landing the second something happens.
Live alert
Zone exit · RC-2204 · 14:32
What Control Tower does
Control Tower is the default screen for anyone running the day: hub leads, dispatchers and operations managers. Instead of asking couriers what is happening, the operation is visible in one place — every vehicle, every event, every open problem in the current shift.
- Live map of the fleet with vehicle status: on route, idle, parked, offline.
- Vehicles on route against total active vehicles, so utilisation is visible during the shift, not the month after.
- Road events as they arrive: accident detection, long idling, unexpected stops, zone exits.
- Efficiency against last week, so a bad day is visible against a baseline instead of a feeling.
- One click from any alert into the vehicle, the courier and the service history behind it.
How it works
Step 1
Vehicles report in
Each vehicle's IoT unit streams position, movement and battery telemetry into RideControl. Mixed hardware from different vendors lands in the same data model.
Step 2
Events are classified
Raw telemetry becomes operational events: idling above threshold, a stop outside a zone, an impact, a vehicle going offline.
Step 3
Alerts reach the right group
Events are scoped to the group tree, so a Warsaw hub lead sees Warsaw and a country manager sees the country.
Step 4
Someone acts
From the alert you can open the vehicle, call the courier, or raise a service request that goes straight to the maintenance kanban.
Step 5
The day is measured
Every event stays on record, so the week can be reviewed by hub, courier and vehicle instead of reconstructed from memory.
Who uses it
| Role | What they use it for |
|---|---|
| Dispatcher | Watching the current shift, reacting to alerts, confirming vehicles are actually on route |
| Hub lead | Vehicle availability for the next shift, chasing idle or offline units |
| Operations manager | Utilisation and efficiency against last week across hubs |
| Country manager | Comparing hubs inside a country without opening each one |
Data you get out
- Event log per vehicle, courier and hub, exportable to CSV.
- Utilisation: vehicles on route versus active vehicles, by hub and by day.
- Alert history with timestamps for accidents, idling, stops and zone exits.
- The same data through the REST API and webhooks, so a delivery platform or BI tool can consume it.
Related modules
Control Tower is the surface; the modules behind it do the work. Zone Guard raises the geofence alerts, Service Flow receives the repairs you create from an alert, and BI dashboards turn a week of events into cost per vehicle.
Frequently asked questions
Related
See it on your own fleet
Book a 30-minute walkthrough. We open the panel with your vehicle types, hubs and countries in mind — no slides.
Book a demo